Statistics & Analytics
View documentation here
Review exponential and logaritmic functions, trigonometric functions, vectors in space, equations of lines and planes.

In this project I completed the following objectives: Install and import python libraries and visualize datasets. Perform exploratory data analysis using matplotlib and plot word-cloud using the WorldCloud library. Perform text data cleaning such as removing punctuation and stop words by calling the punctuation function using the string library.
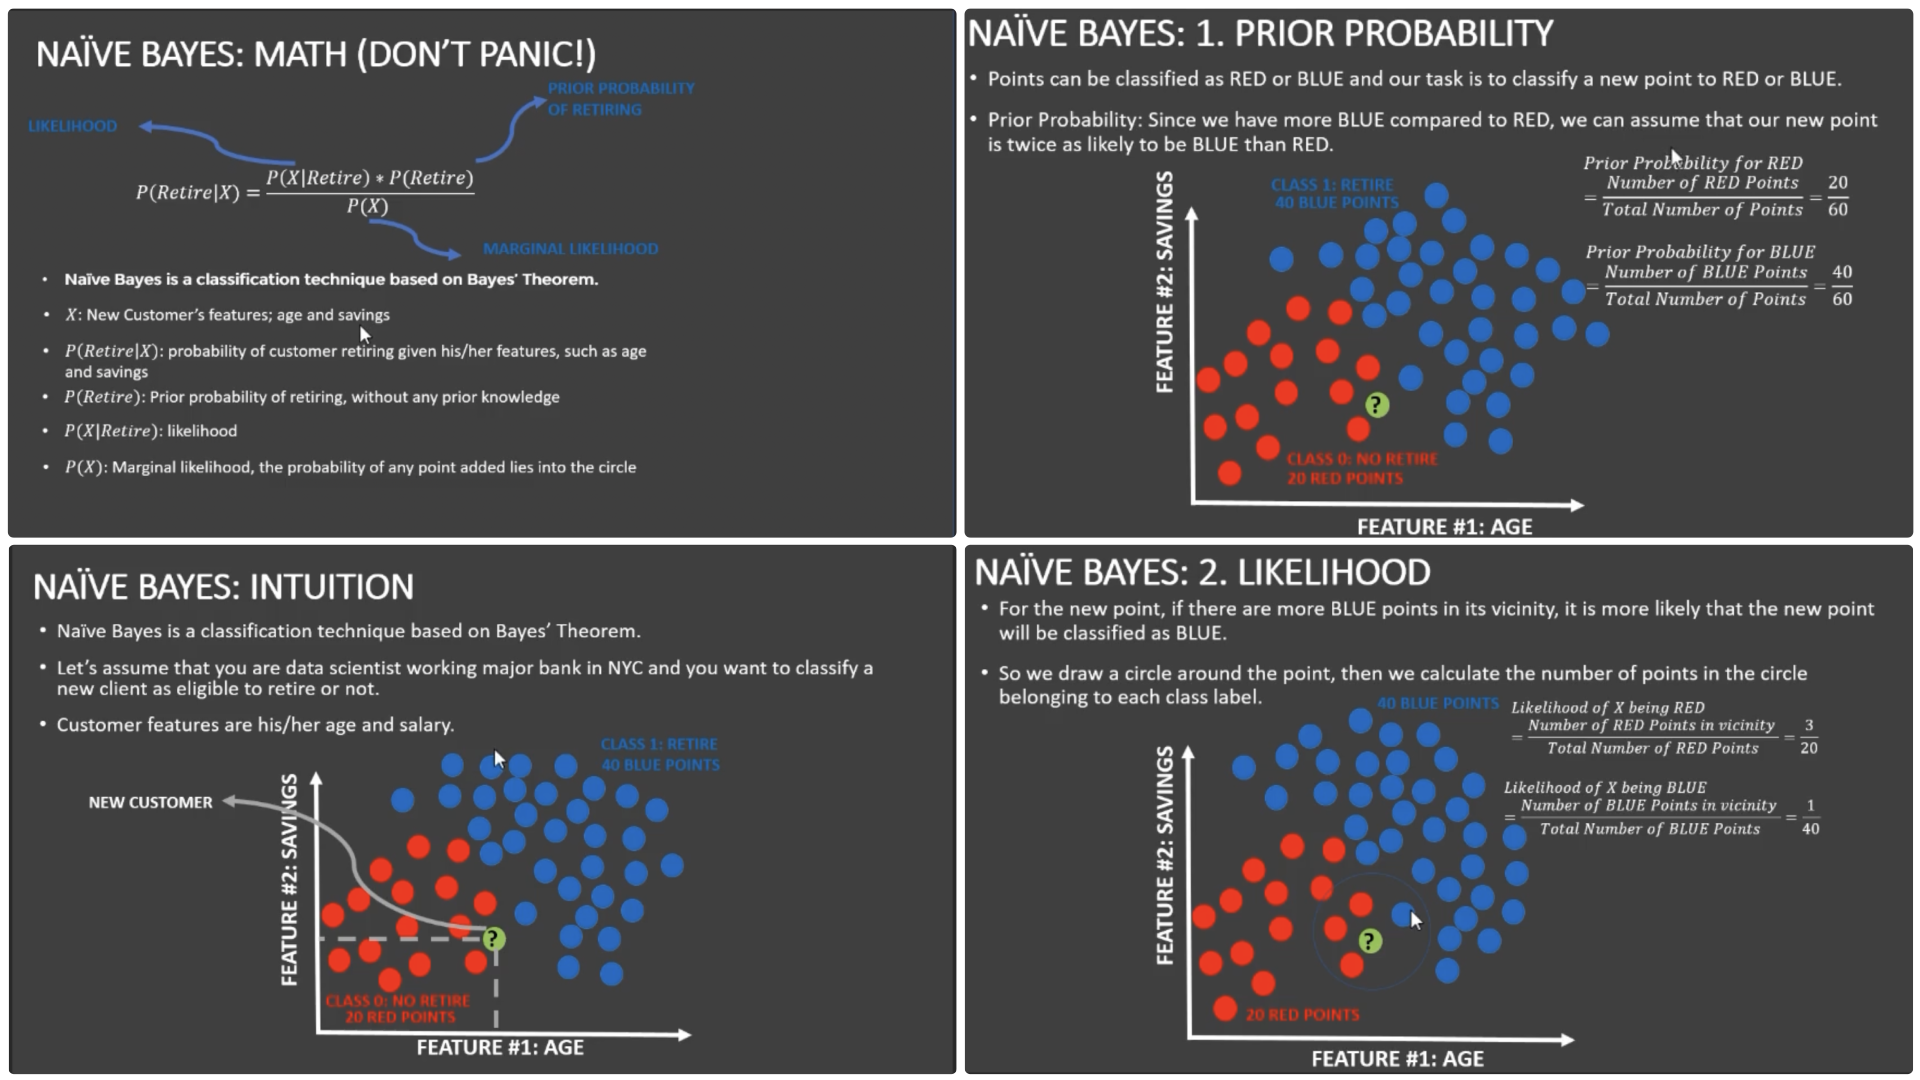
Understand the concept of count vectorization (tokenization). Perform tokenization to tweet text using Scikit Learn. Understand the theory and intuition behind Naïve Bayes classifiers. Understand the difference between prior probability, posterior probability and likelihood. Train Naïve Bayes classifier models using Scikit-Learn to preform classification. Evaluate the performance of trained Naïve Bayes Classifier model using confusion matrices. See Github to browse code.
Extract features from an image and feed those features in a Machine Learning model.
The extraction methodology involves the following: extracting features of an image and processing it in numpy arrays, and handling those numpy arrays appropriately to obtain the proper format of the data that could be used in a machine learning model See Github to browse documentation
Utilize a data set that includes data on the gender, occupation, and salary range of a sample size of Americans to predict salaries based on attributes (categorical attributes such as marriage, occupation etc.) by building a decision tree. See Github to view code and documentation
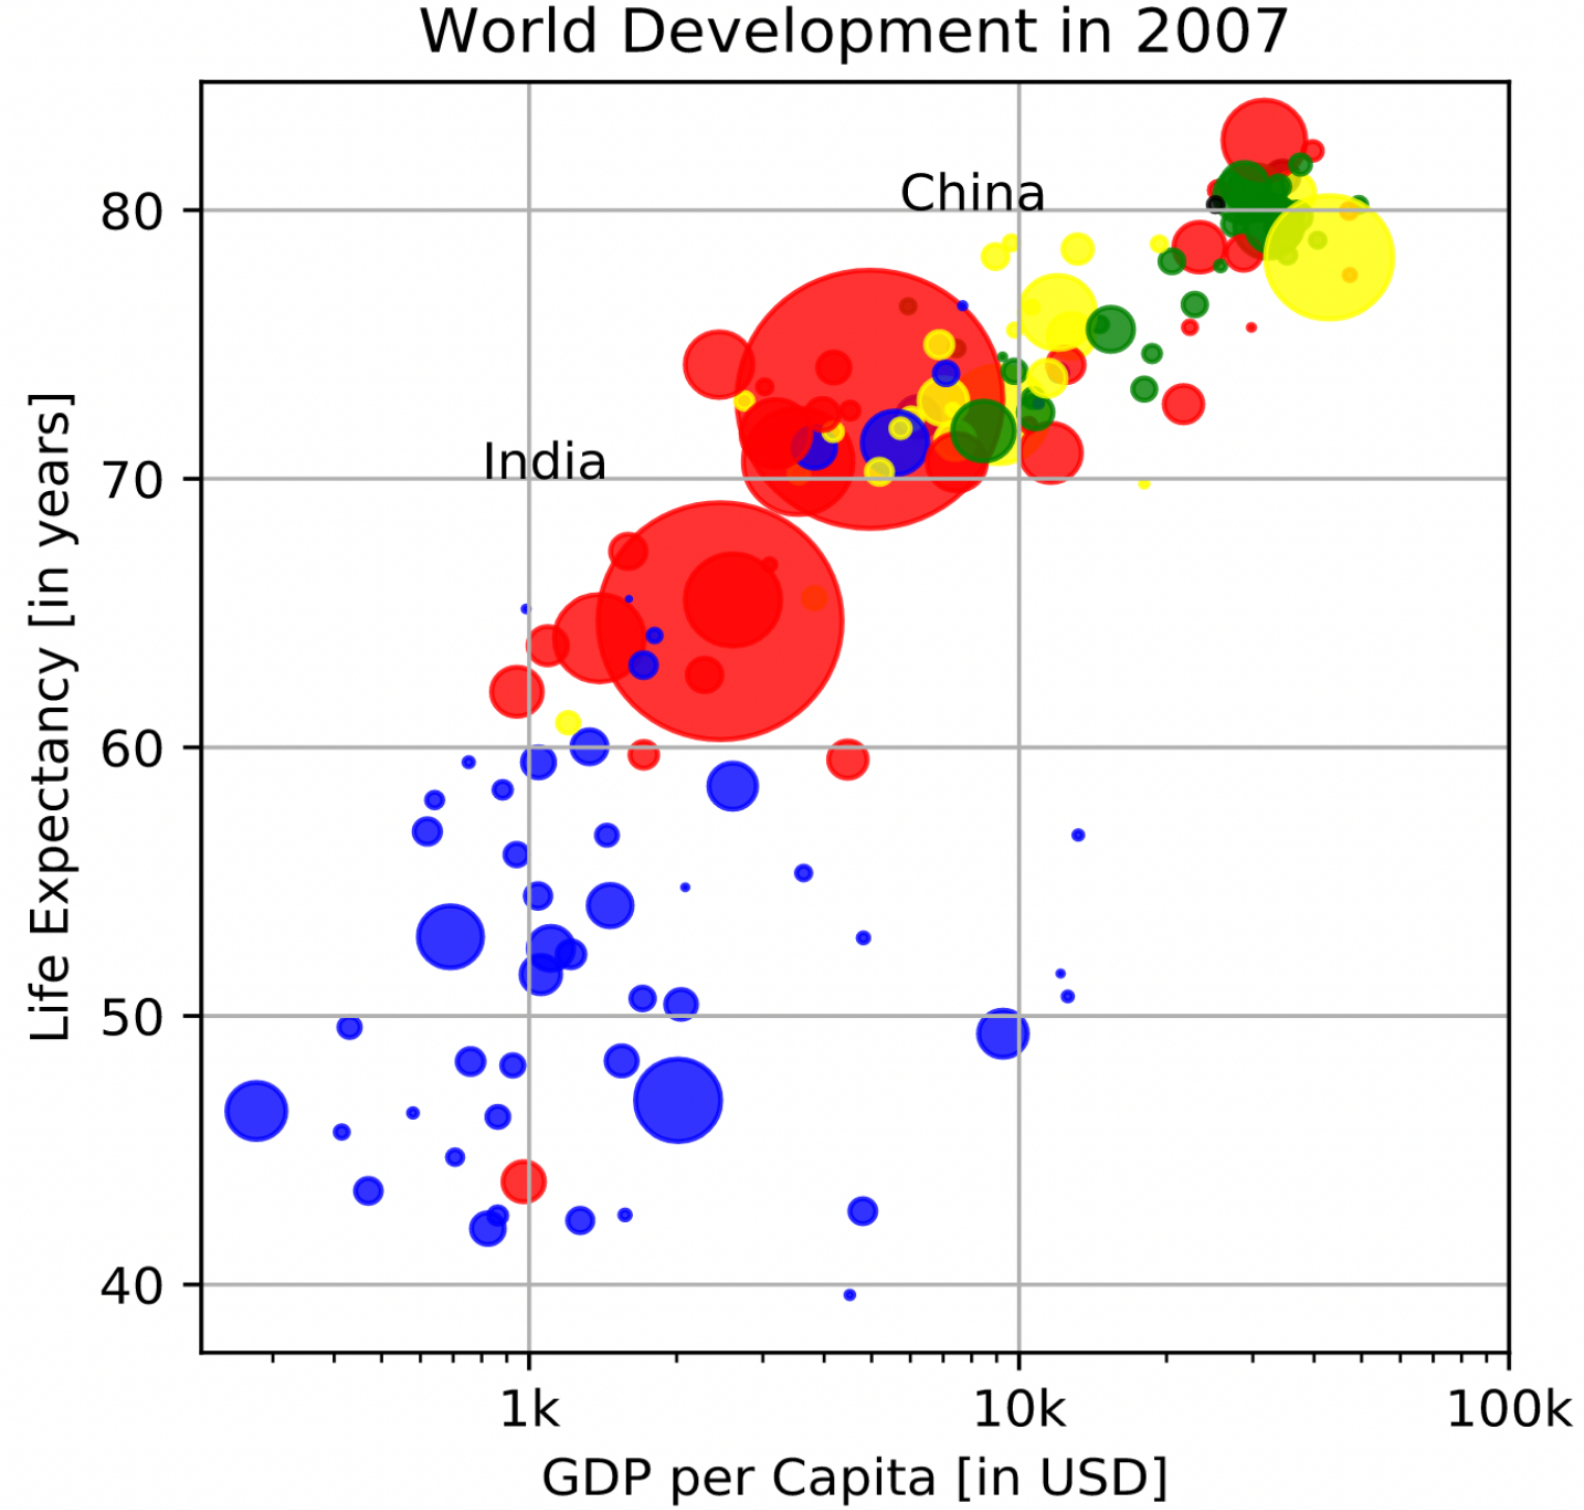
Use the matplotlib library from Python to develop a scatterplot visual, with customizations, of the Gapminder World Map, which shows the correlation between life expectancy and GDP Per Capita of multiple countries. See Github to browse code
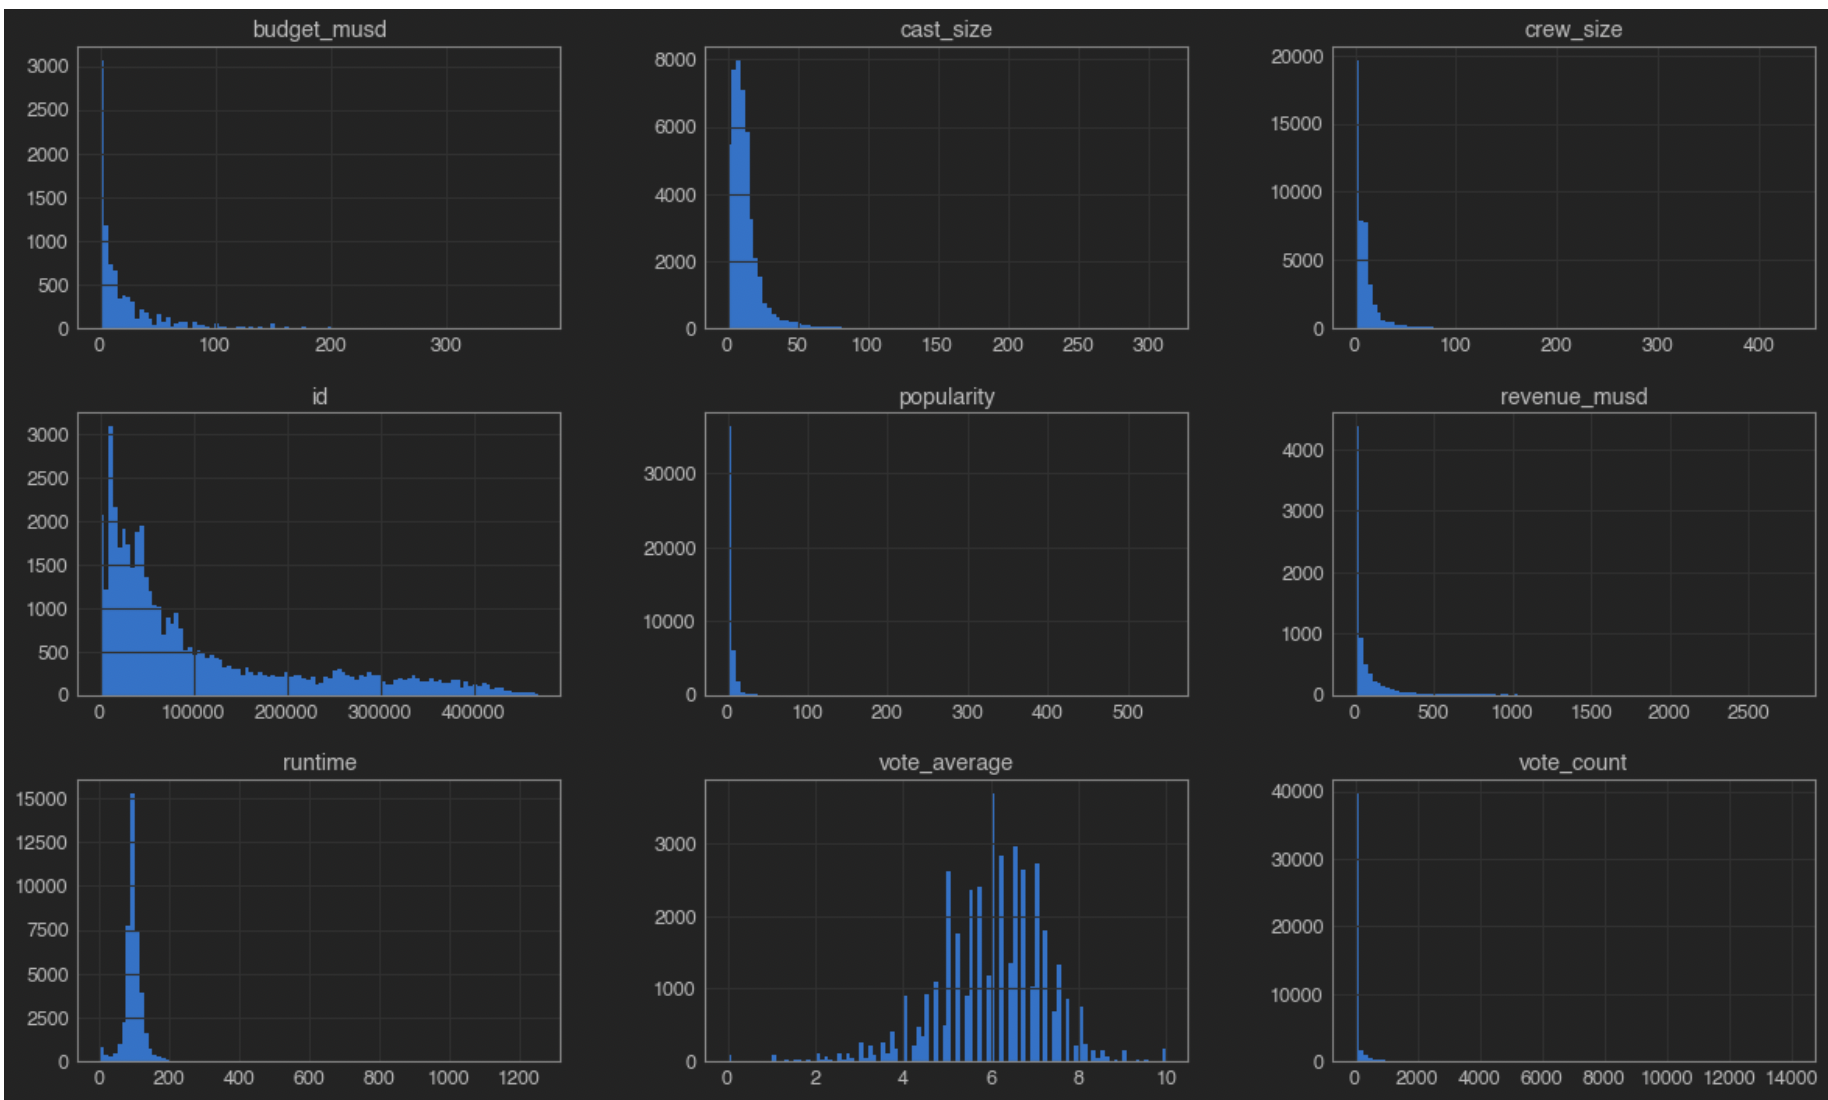
Perform data analysis on a dataset of movies and their respective details using python in Jupyter Notebook. See Github to browse code